Risk taking has returned to the markets with Russia settling down, Greece kicking the can 4 months down the road, and European economic data coming in better than expected. As a result, the global equity markets continue to lift with many of the major indexes setting new record highs.
Tech:
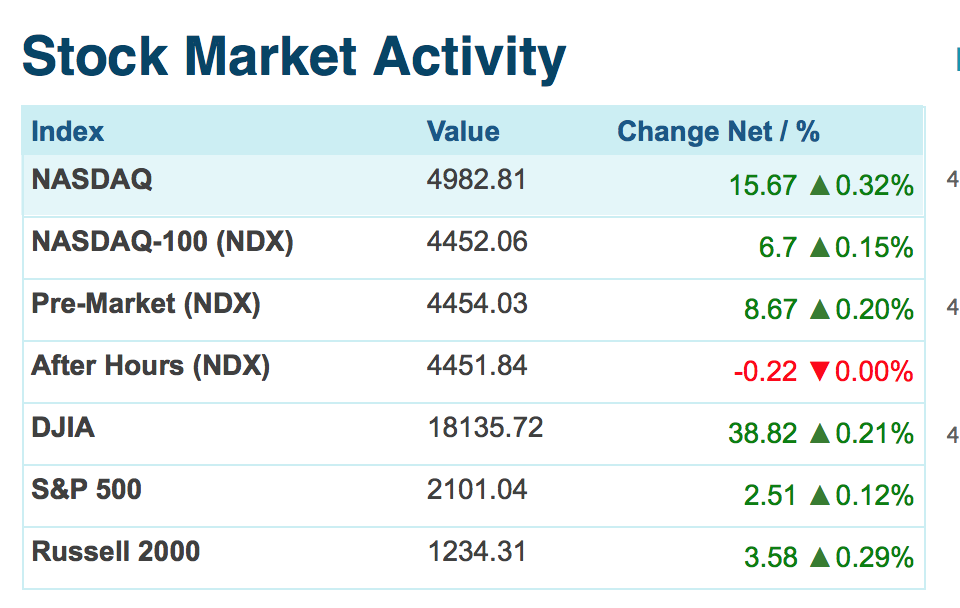
“What was propelling the NASDAQ in the year 2000 was a dream. What’s driving the NASDAQ today is reality,” says Gavin Baker, who runs the NASDAQ -focused Fidelity OTC Portfolio fund. “The current valuation is very well supported by earnings and cash flows and if those earnings and cash flows continue growing, the NASDAQ should continue going up.” Patience and fundamentals have been force-fed on NASDAQ investors. The nearly 3,900-point recovery has taken 12 years. In the 1990s, the NASDAQ had managed the same 350% gain in just three. The dot-com rally, of course, was powered by wildly inflated multiples. In March 2000, the NASDAQ traded at well over 100 times earnings. Today, the NASDAQ has a price/earnings multiple of 21, a few ticks above the Standard & Poor’s 500, at 17.5.
(Barron’s)
Oil:
Recently we have witnessed the US, Europe, and Asia filling up storage containers. The Saudi hopes of restructuring the oil market are taking longer than they expected. By refusing to rein in production while prices fell, the Saudis permitted a big surplus to grow and served notice on higher-cost rivals (Russia, Venezuela, and America-Shale) that they would not prop up other folks profit margins at the expense of their own market share.
That signal has been weakened by the growing amount of oil in storage, which is absorbing most of the glut. World oil stocks rose by about 265m barrels last year and Société Générale, a French bank, reckons they will increase by a further 1.6m – 1.8m barrels a day in the first six months of this year, adding roughly 300m barrels to the total. Oil is being stored in the hope that demand and prices will pick up later. The restocking cannot continue for long. Storage facilities in Europe and Asia are already 80-85% full. As it is, companies are renting tankers to keep oil. If storage space runs out, prices could tumble again.
Until last year, few investors doubted the benefits of holding one or more integrated oil stocks in a portfolio. But then the price of oil fell in half in just a few months, and even these normally stable performers began to fall sharply as well. Some value investors think that now is not the time to be selling Big Oil. They argue that these stocks, which sport among the best dividend yields in the large-cap space, look cheap and could perform nicely if oil continues a price turnaround that began in late January. But the No vote on Big Oil got a boost with the news in the past day that Berkshire Hathaway (ticker: BRKA), the investment holding company controlled by Warren Buffett, sold off its sizable stakes in ExxonMobil (XOM) and ConocoPhillips (COP) sometime in the fourth quarter.
Europe:
Over the past 7 years or so the U.S. market, as measured by the S&P 500 has outperformed developed European markets by a bit over 60%. This seems to be a normal 7 ish year cycle. Over the past 35 years the S&P and the European 350 have flipped flopped each other with uncanny predictability. Could it be time to warm up to Europe? Considering the European Central Bank (ECB) has signaled they will inject more than a trillion dollars into the economy, perhaps Europe will have some economic tailwind. Additionally the fall in crude prices are a net win for Europe as most of Europe imports nearly 100% of their energy, another tail wind. Lately we have been hearing from large worldwide companies such as Hewlett-Packard, that the strengthening of the dollar and subsequent weakening of the Euro has served as a big head wind for U.S. companies. Currency is certainly another tail wind for Europe. Looking at valuations, the CAPE (defined below) currently values the S&P 500 on a forward basis around 24. The running average is 19. This means either earnings have to continue to grow or the S&P is due for a pullback. Conversely the forward CAPE valuation of the European 350 is currently 14. The average for Europe is 16. This indicates some growth for the European 350.
The cyclically adjusted price-to-earnings ratio, commonly known as CAPE, Shiller P/E, or P/E 10 ratio, is a valuation measure usually applied to the US S&P 500 equity market. It is defined as price divided by the average of ten years of earnings (Moving average), adjusted for inflation. (Wikipedia)
I close with this:
Recently the FCC approved the net neutrality rules. Here are some of the quotes following this approval. Let me say…………this will likely remain an ongoing battle for years to come.
Jim Cicconi, AT&T’s senior executive vice president for external and legislative affairs, criticized the vote. He warned of legal challenges but stopped short of saying the company would sue.
“We have never argued there should be no regulation in this area, simply that there should be smart regulation,” Cicconi said. “What doesn’t make sense, and has never made sense, is to take a regulatory framework developed for Ma Bell in the 1930s and make her great grandchildren, with technologies and options undreamed of 80 years ago, live under it.”
Verizon highlighted its view that the FCC was taking an outdated approach by handing out copies of a news release that was typed on a 1930s-era typewriter that said “it is likely that history will judge today’s actions as misguided.”
Michael Powell, president of the National Cable & Telecommunications Assn. trade group, said Congress should overrule the FCC’s net neutrality approach with more restrained regulations.
And Powell, who chaired the FCC in 2002 when it specifically decided not to classify broadband under Title 2, hinted of the legal challenges to come.
“The FCC has taken us in a distressing direction,” he said. “We must now look to other branches of government for a more balanced resolution.”
Kelly G. Compton
Chief Investment Officer, WCM Wealth